How a Global Architecture Firm uses Layer to Survey and Share Equipment Data
"Layer has a nice thing going in terms of how much flexibility it provides and how easy it is to use."
Laura Babinski
The Challenge: Managing a Large Amount of Data
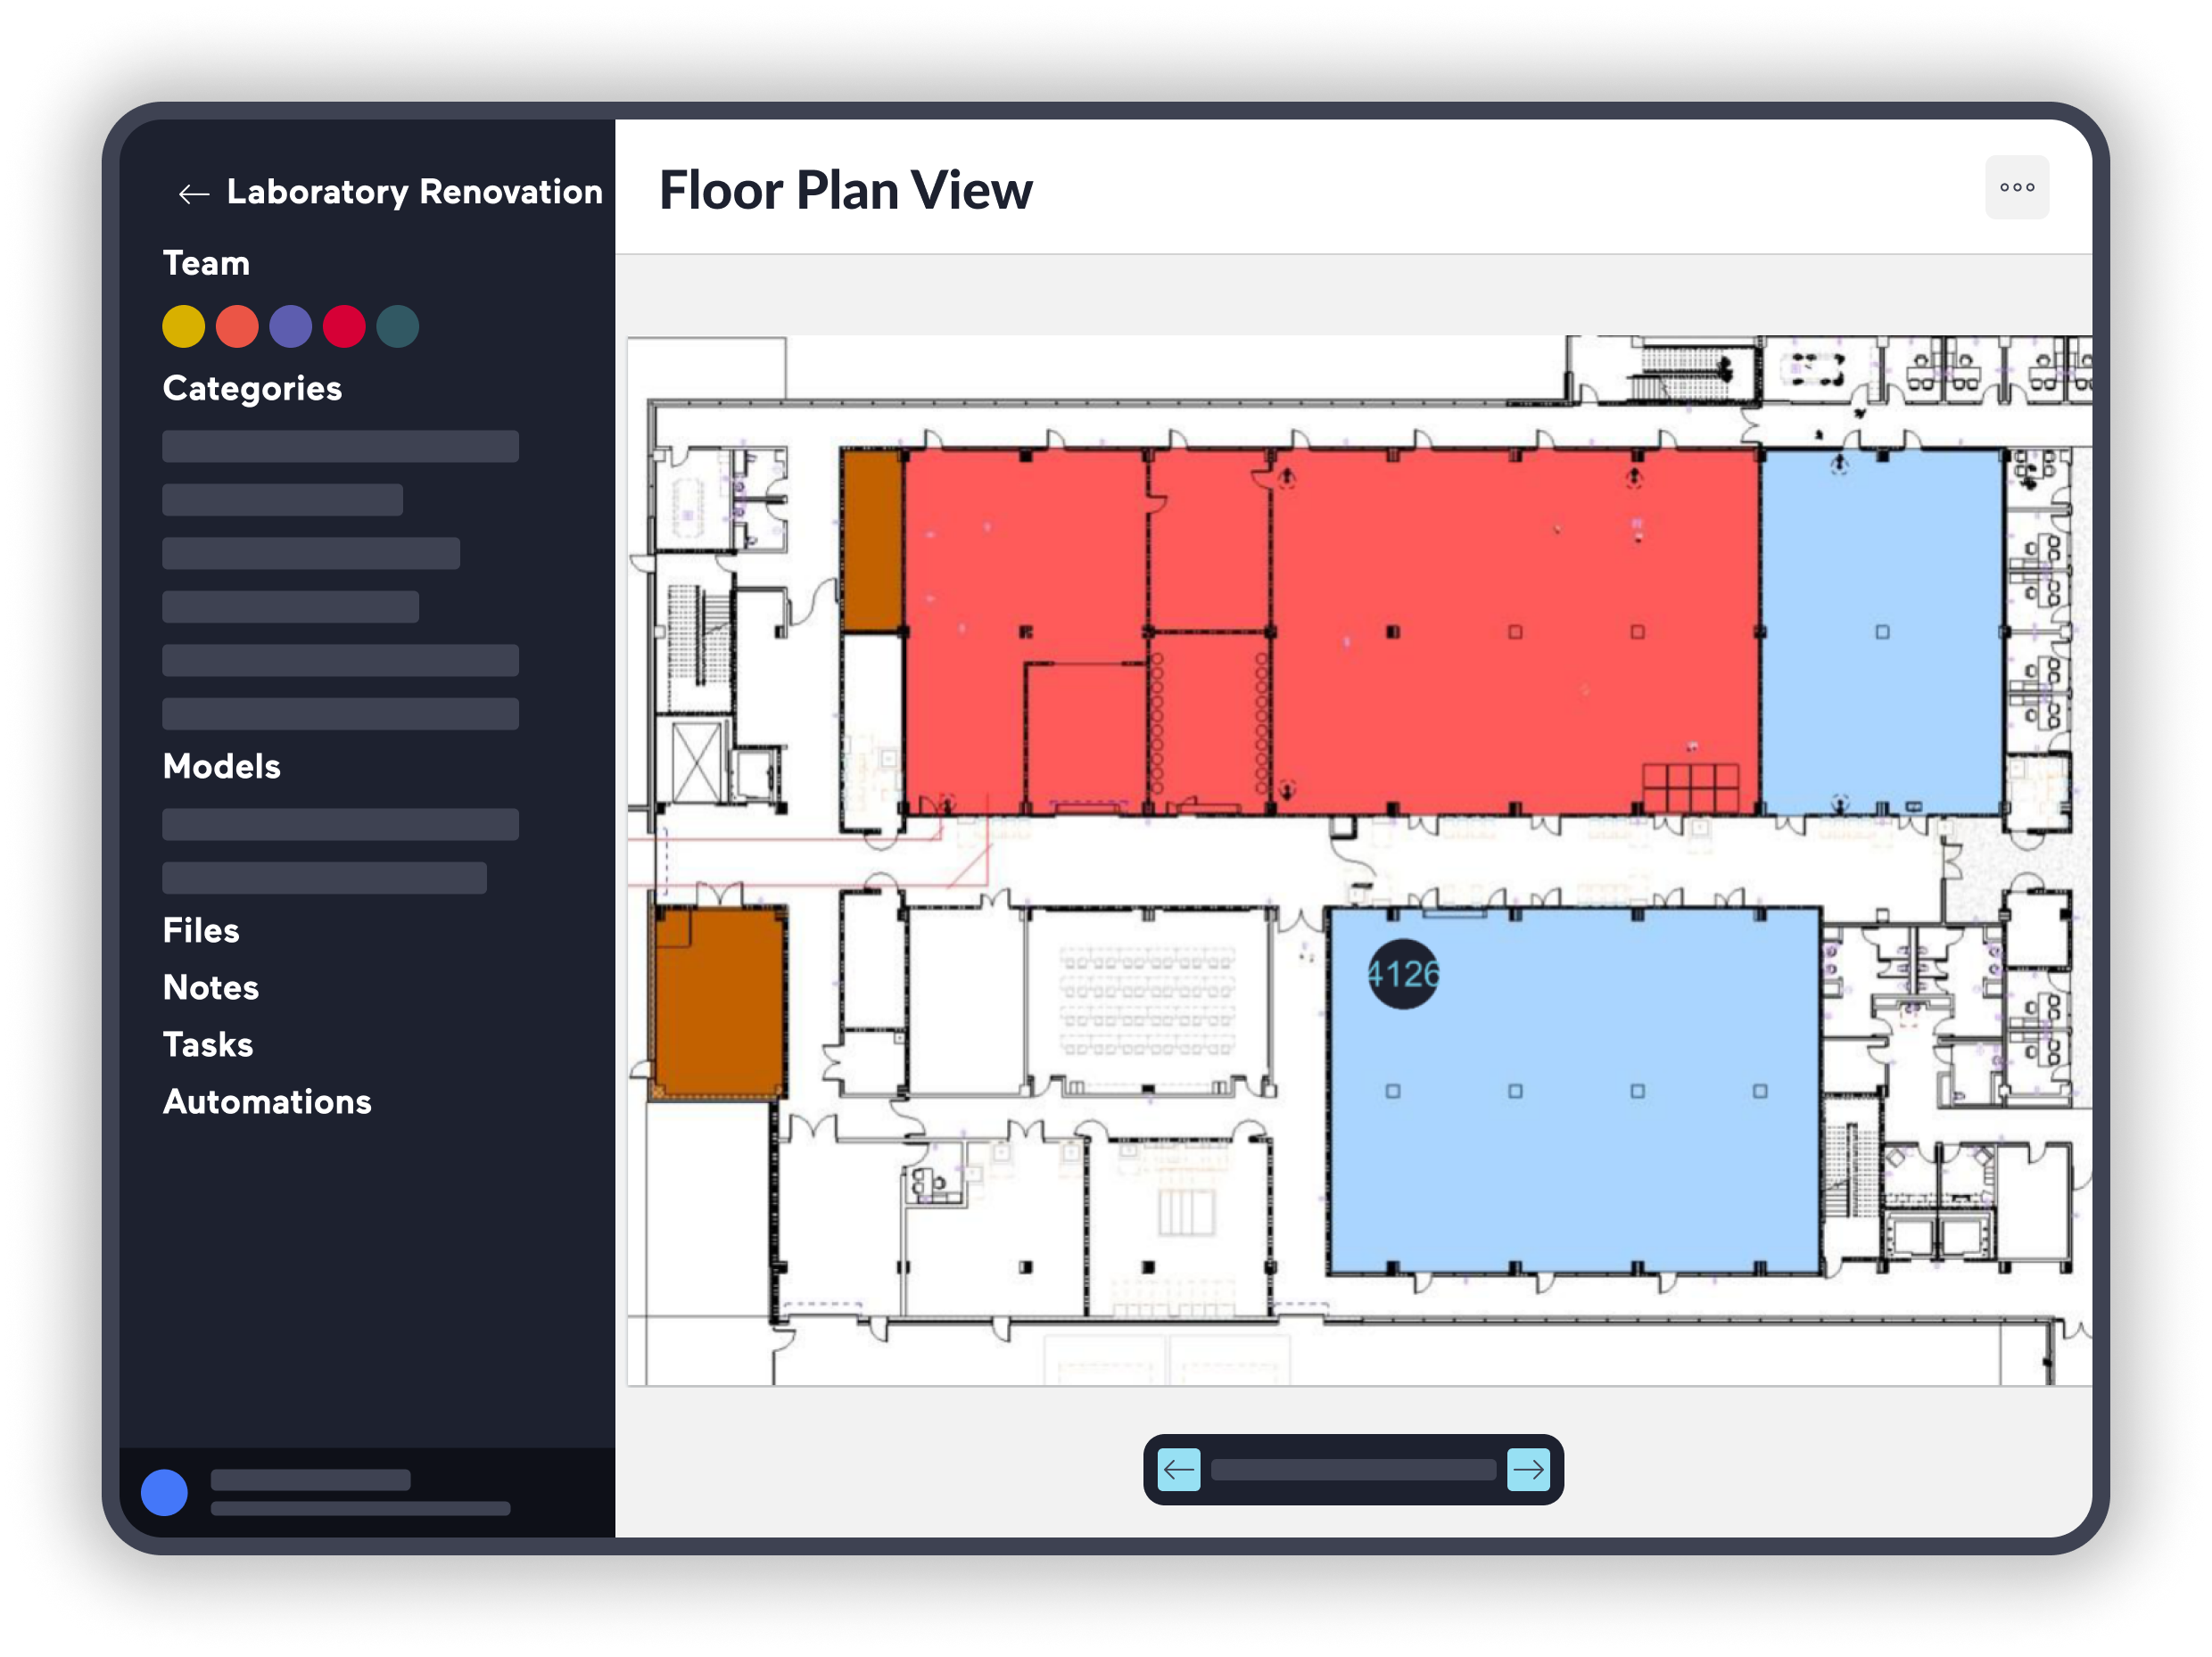
SmithGroup is leading a complex, long term Laboratory project including renovations and new build of more than 400,000-sf, at a chemical facility campus. To do this, the team needed to survey the entire campus’ existing spaces. This meant documenting over 3,500 pieces of equipment, office furniture, and other items across 12 buildings.

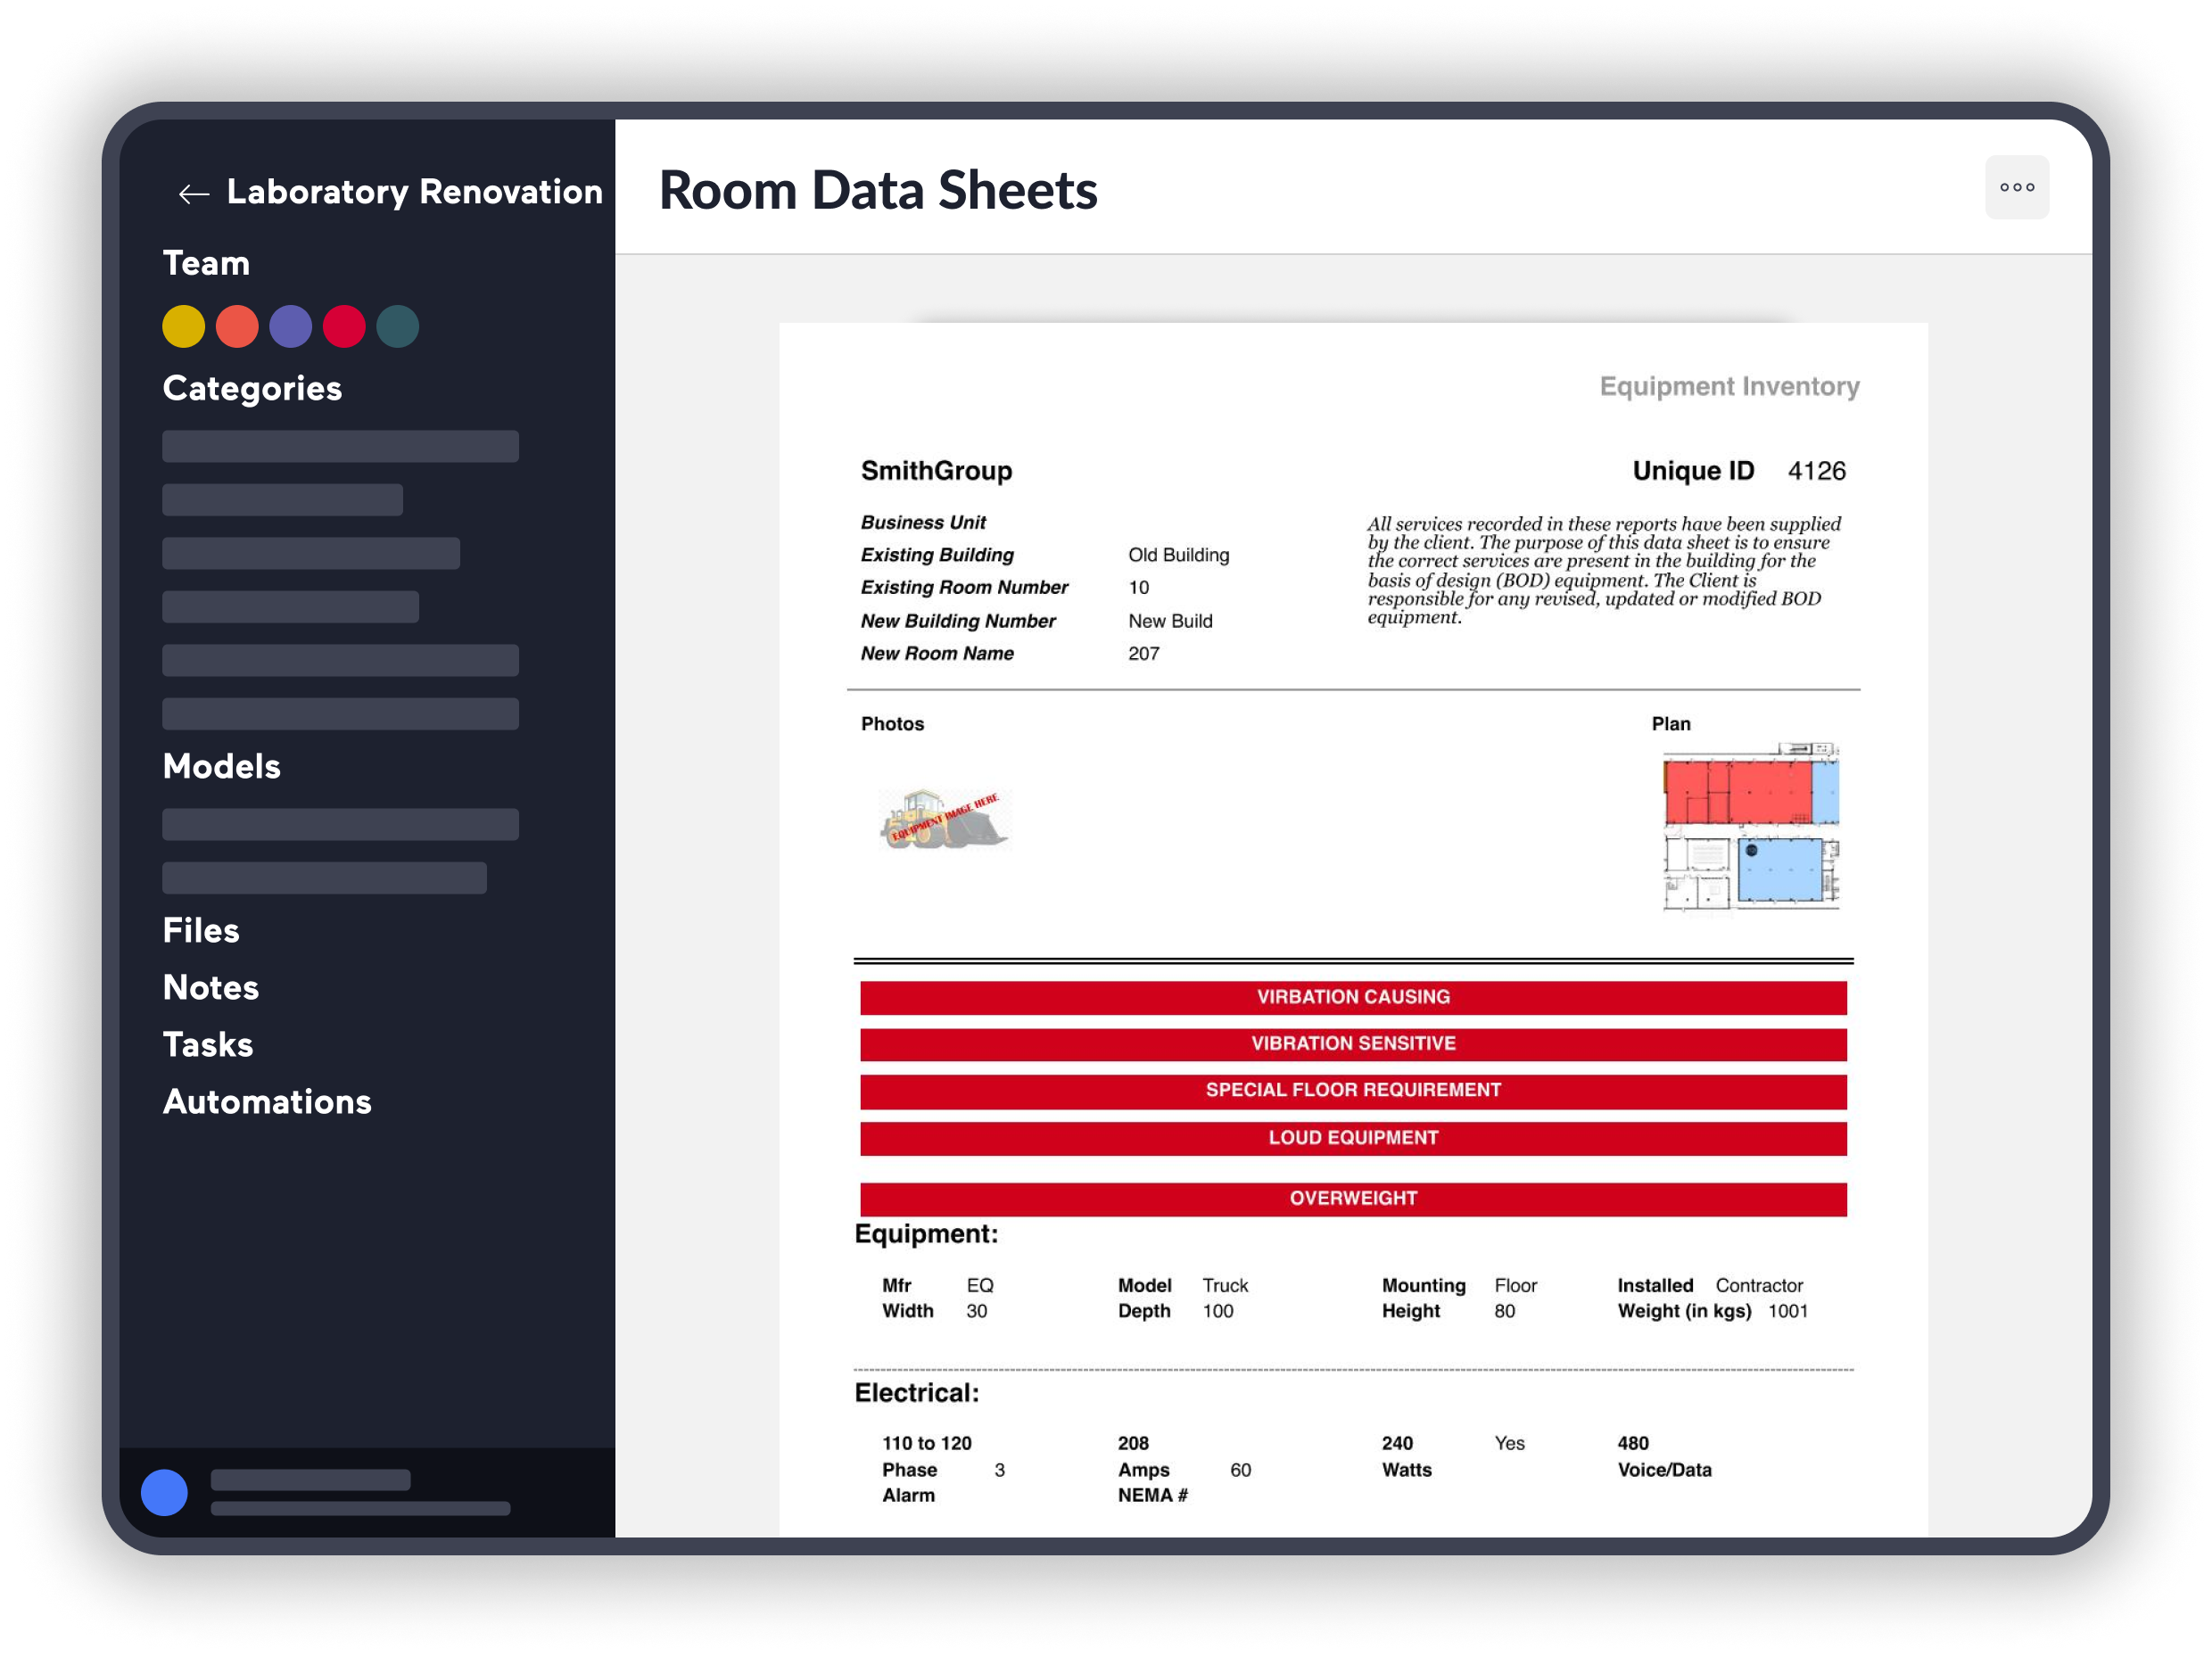
*Image not of project specified in this production
Managing that much assessment data is messy. Establishing a method to gather data in a structured manner became critical. Without one, SmithGroup ran the risk of inaccurate or lost data.
They collected equipment location, manufacturer details, model numbers, dimensions, and mounting requirements. The team needed a way to link these data points back to the corresponding chemical lab equipment. Later it would be used to generate field reports to share with stakeholders.
Before, the team would spend hours organizing the data after they’ve collected it. They used Sharepoint, Excel, and InDesign and were hoping to replace that workflow with a single tool. For the sake of efficiency, the team sought a more automated and optimized solution.
The Solution: Simplified Data Collection & Presentation
This project is in the strategic planning phase. The team has already collected a vast amount of data.
They’ve conducted field surveys, determined renovation requirements, and planned equipment relocation or replacement. The result? Data for over 3,500 pieces of equipment across 12 buildings. All in Layer.
This will provide invaluable data for the general contractor as they start working on the office and lab renovations.
“One of the best things that Layer has been able to do for us photo organization on site,” exclaims Babinski. Layer enabled SmithGroup to snap a photo of the equipment and link it to a location on the plans. This eliminated the need for post-data organization, resulting in less errors and time saved.
“The team had all that critical data connected when they went back to the office,” stated Babinski. Rather than spending time organizing the data, the team “simply filled in any missing information in the database.” From there, SmithGroup set up graphic room-by-room reports using Layer. The same data was automatically formatted into an appealing graphic.
Layer’s integration with Revit became an added benefit to the team. SmithGroup developed a Dynamo script that would create generic 3D Revit Families using the dimensions listed in Layer. Each 3D Revit Family linked back to the Layer equipment through the Layer ID. Because Layer is live linked to Revit, the 20+ data points that pertain to each equipment are viewable in Layer.
SmithGroup plans to continue using this thorough database for the rest of the project. Their effort in setting up their Layer and Dynamo workflow will prove fruitful during later stages of design. Rather than spending time wrangling the pieces of data together, the team will be able to spend that time thinking through the renovation, relocation, and replacement of all the equipment surveyed.